Trade with
Edge
Not with fear
One terminal for every market — equities, ETFs, index futures (ES, NQ), crypto and forex — read through a live gamma map, institutional-scale flow, and a headline feed that never sleeps.
See where positioning concentrates, watch size hit the tape the instant it prints, and read which way the session is leaning — all in one place, all session long.
One glance. Which way the session is leaning.
Market Bias and Session Profile are two independent reads of the same session — the same question, filtered twice. The live needle shows which way the session is leaning right now. The profile bar shows how it has leaned cumulatively, all session long. When the two agree, that is a double-filtered read of the day; when they diverge, that tells you something too. Two filters, one answer.
Built for futures and equities alike — NQ, ES — and it holds in any condition the session hands you: trending or chopping, risk-on or risk-off. The lean translates to whatever you trade. A research lens on the session, never a signal to act on — the read is yours to make.
The Map shows you the walls before you trade into them.
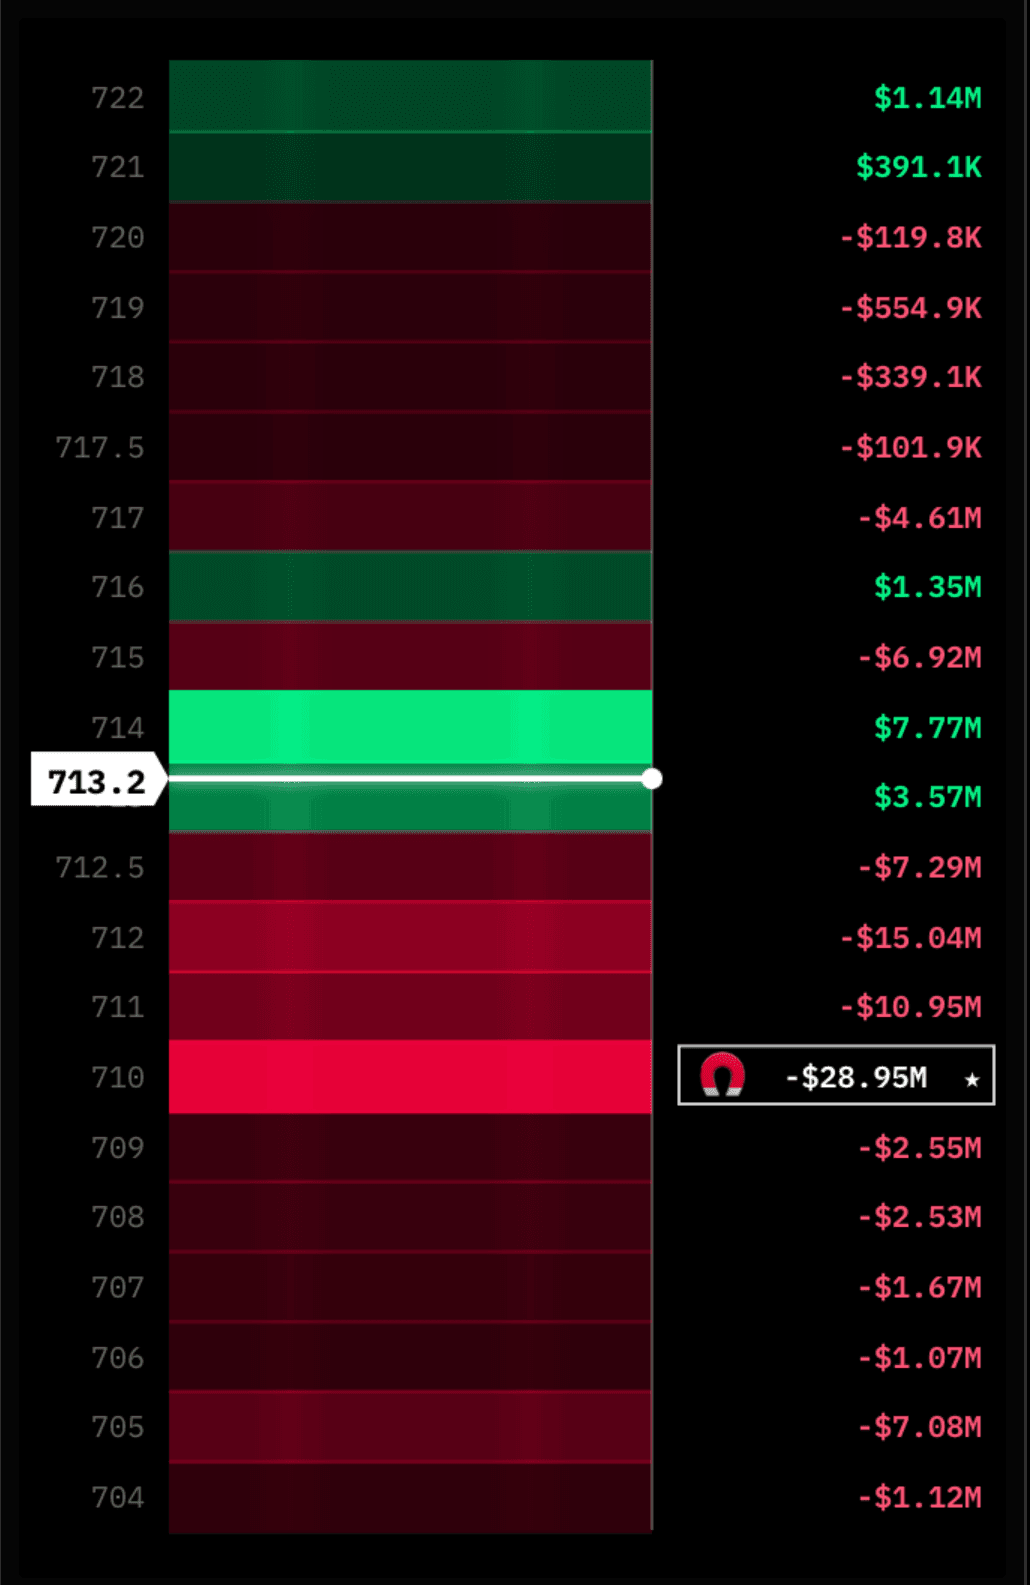
The market's heaviest positioning shows up as gamma walls — the strikes where dealer hedging concentrates and price tends to gravitate. The Map lays the whole book out by strike, so the structure is obvious at a glance.
That structure is context for where to engage — and when to stand aside. A strike stacked with heavy opposing positioning is a level you can see before you take the trade rather than after, and a book that reads mixed rung to rung describes the choppy, two-sided conditions many traders would rather sit out entirely.
Two lenses on the same ladder — pick the one your timeframe calls for. Near-term isolates the short-dated book, the expirations 0DTE traders and intraday scalpers actually live in; SPX, SPY and QQQ positioning moves in step with ES and NQ, so a futures desk gets an index read out of the options book itself. Total book stacks every expiration instead — the wider structural picture, sized for swing horizons.
Built on near-term open interest, normalized to per-point dollar gamma. It opens as the MAP tab in the terminal — a research visualization of positioning, never a prediction, never a recommendation.
The size finds you.
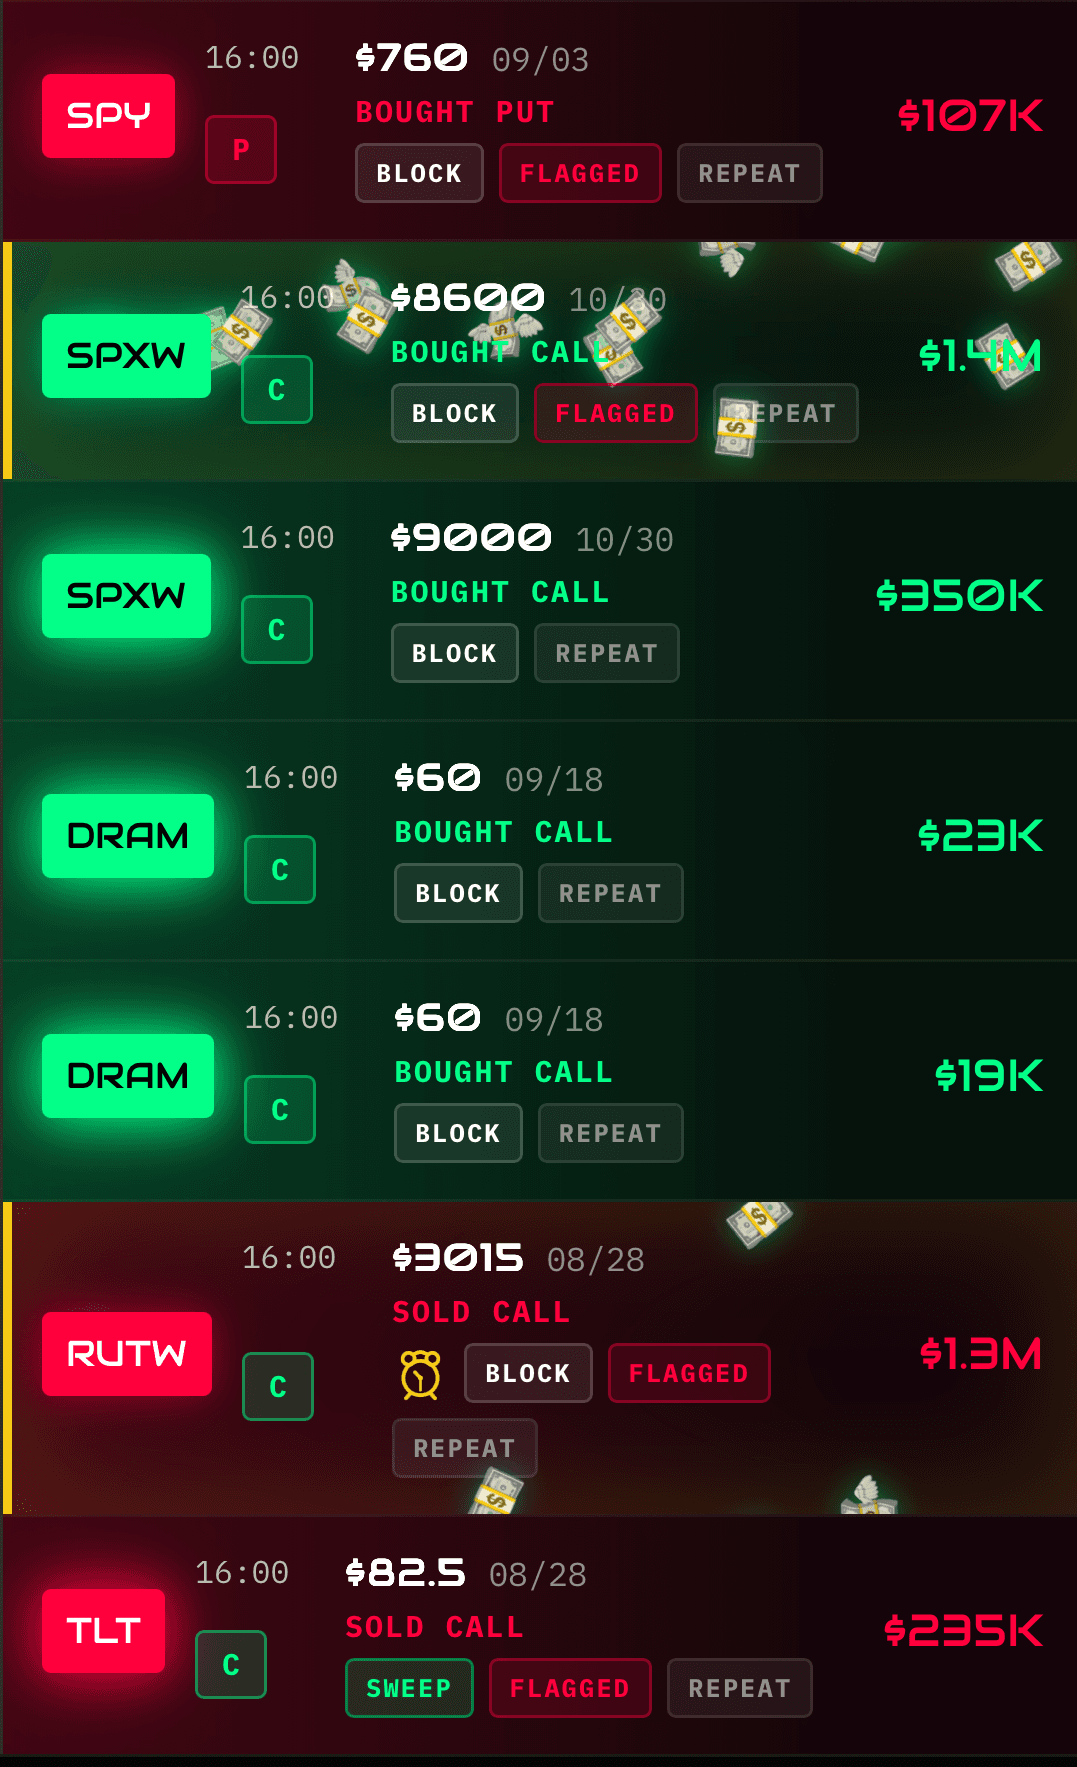
Institutional-scale prints stream in the moment they hit, and the tape is built to be read at a glance rather than parsed. Color and glow do the work: a whale-sized order lifts off the row on its own, so the prints worth a second look reach you before you go looking for them.
Each print carries its own tags — sweep or block on the execution, a repeat marker when the same name keeps getting hit, and a flag on the outliers. No scrolling walls of numbers to find the one line that mattered.
For traders who want flow context without living inside a raw tape. It opens as the FLOW tab in the terminal — a research visualization of prints as they occur, never a prediction, never a recommendation.
The whole market, one screen.
Every subscription opens the full terminal — twenty-one research modules spanning equities, options, crypto, forex, and macro, the flagship reads among them.
No tiers.
No upsells.
The full terminal, the same for every subscriber. No personalization, no advice, no fiduciary relationship — just the research.
- Gamma / GEX positioning heatmap
- Market Bias + Session Profile — a double-filtration read for equities and futures (NQ, ES)
- 24/7 market headline feed
- Dark pool, net premium & tide
- Congress, insider & institutional activity
- Short interest, volatility & seasonality
- Screeners, per-ticker financials & technicals
- ETFs, economy, sector flow & top movers
- Crypto boards, charts & whale-trade flow
- Forex boards & charts
- Configurable Live Market Watch
- Plus earnings & economic calendars, institutional data, and much more
Secured by Stripe · Auto-renews monthly · Cancel anytime · USD